Debugging C++ in VSCode, MacOS/LLVM/Clang edition
I've been using Visual Studio Code and its variants—like Google's internal Cider IDE—since they were released. However, to my own embarrassment, whether at Google, Waymo, or Cruise, I've never set up C++ debuggers on my own. Instead, I've always followed internal instructions.
I had been avoiding learning about the purpose of the .vscode directory and how to write configuration in launch.json. But after reading the documentation, watching YouTube videos, and chatting with Claude, I realized it's not as complicated as I thought.
Most of the instructions I found aim to be generic, covering all operating systems and C++ compilers. Instead, I want to share a specific, narrow use case that I personally use for my experiments: running on macOS with the latest version of LLVM (21.1.0 at the time of writing) and using Clang as the compiler frontend.
First, install LLVM:
brew install llvm
Next, create a file and add a configuration.
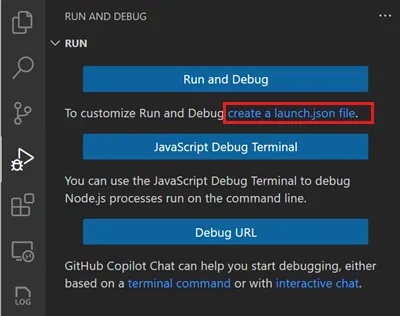
I didn’t create one from scratch—I just used the default C++ configuration suggested by VSCode:
{
    "version": "0.2.0",
    "configurations": [
        {
            "name": "(lldb) Launch",
            "type": "cppdbg",
            "request": "launch",
            "program": "${fileDirname}/${fileBasenameNoExtension}",
            "args": [],
            "stopAtEntry": false,
            "cwd": "${workspaceFolder}",
            "environment": [],
            "externalConsole": false,
            "MIMode": "lldb",
            // "preLaunchTask": "build",
        }
    ]
}
Now for the interesting part! The launch configuration defines how to run a compiled version of a program, but it doesn’t specify how to compile it with all the necessary artifacts for debugging.
To handle that, we need to define what's called a "task"—something VSCode can execute on demand. Essentially, it's a stored command template, similar to a bash script but with extra variables and features that help automate processes within VSCode. I know that sounds a bit abstract, so let me show you the "build" task Claude created for me. I prefer C++17 since I am a big fan of std::optional and std::variant:
{
    "version": "2.0.0",
    "tasks": [
        {
            "label": "build",
            "type": "shell",
            "command": "clang++",
            "args": [
                "-g",
                "-std=c++17",
                "${file}",
                "-o",
                "${fileDirname}/${fileBasenameNoExtension}"
            ],
            "group": {
                "kind": "build",
                "isDefault": true
            },
            "presentation": {
                "echo": true,
                "reveal": "silent",
                "focus": false,
                "panel": "shared",
                "showReuseMessage": true,
                "clear": false
            },
            "problemMatcher": ["$gcc"]
        },
        {
            "label": "clean",
            "type": "shell",
            "command": "rm",
            "args": [
                "-f",
                "${fileDirname}/${fileBasenameNoExtension}"
            ],
            "group": "build",
            "presentation": {
                "echo": true,
                "reveal": "silent",
                "focus": false,
                "panel": "shared"
            }
        }
    ]
}
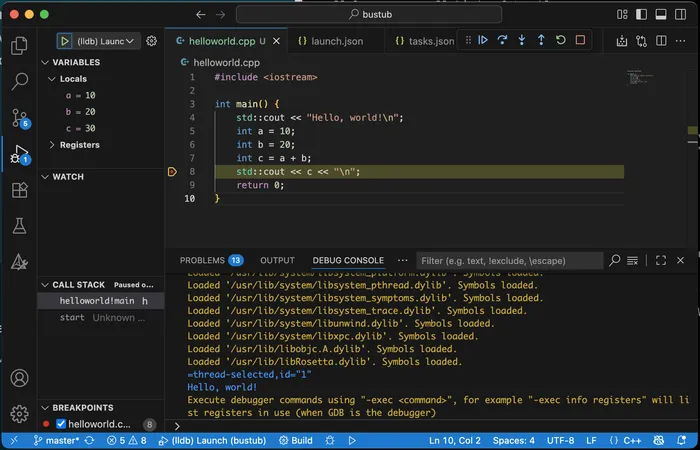
Just save it into a .vscode/tasks.json file, and it will automatically become available in the configuration. We can now safely uncomment "preLaunchTask": "build" line in the launch.json file and can start the debugger with a single click, just like in the screenshot above.
You can now make two key generalizations. First, you can automate even more tasks and access them directly from the command palette. Second, you can create multiple configurations for different components of your system or various apps in your monorepo. These configurations are all shareable if you check them into version control.
Happy Debugging 🕵🏻♂️🐞